
Dashboards
Four ready dashboards, and yours the way you want them
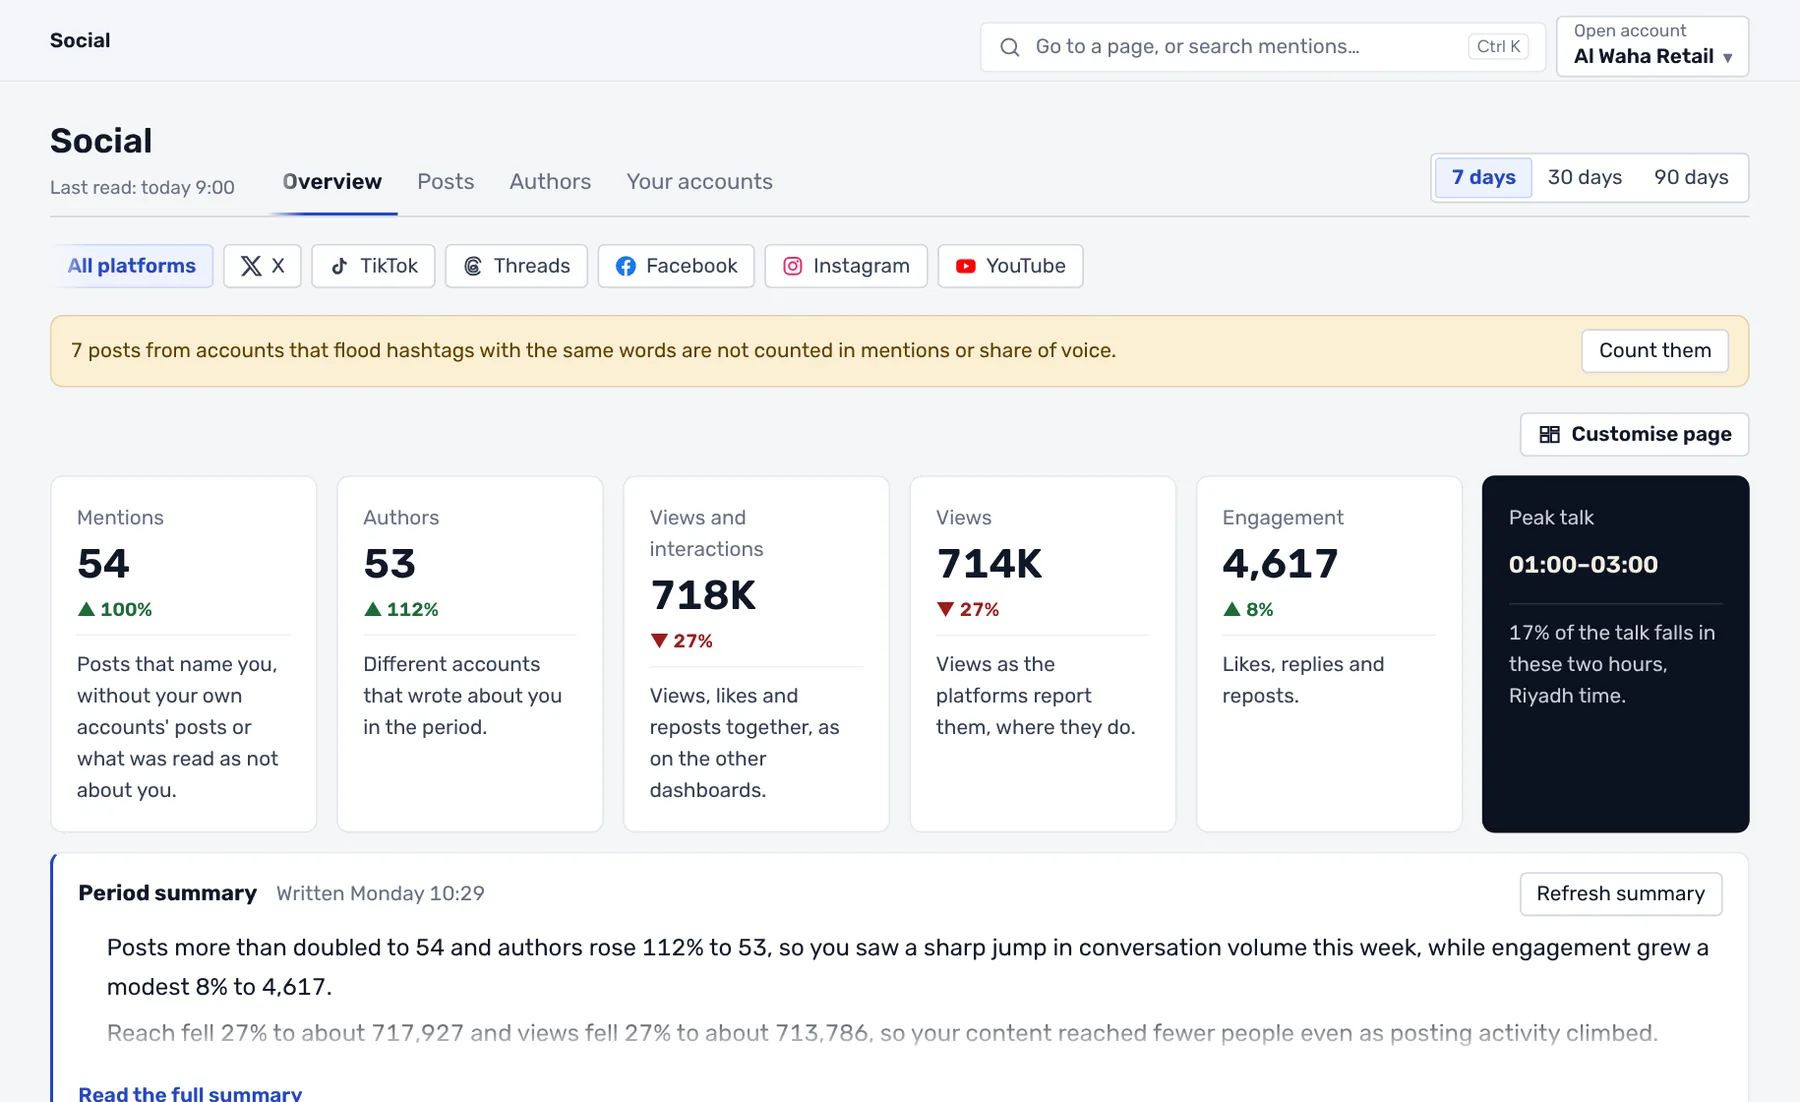
Home, news, social and reviews are ready from day one and update through the day. If you want others, build them: choose the widgets, sources, competitors and period, and save them by name.
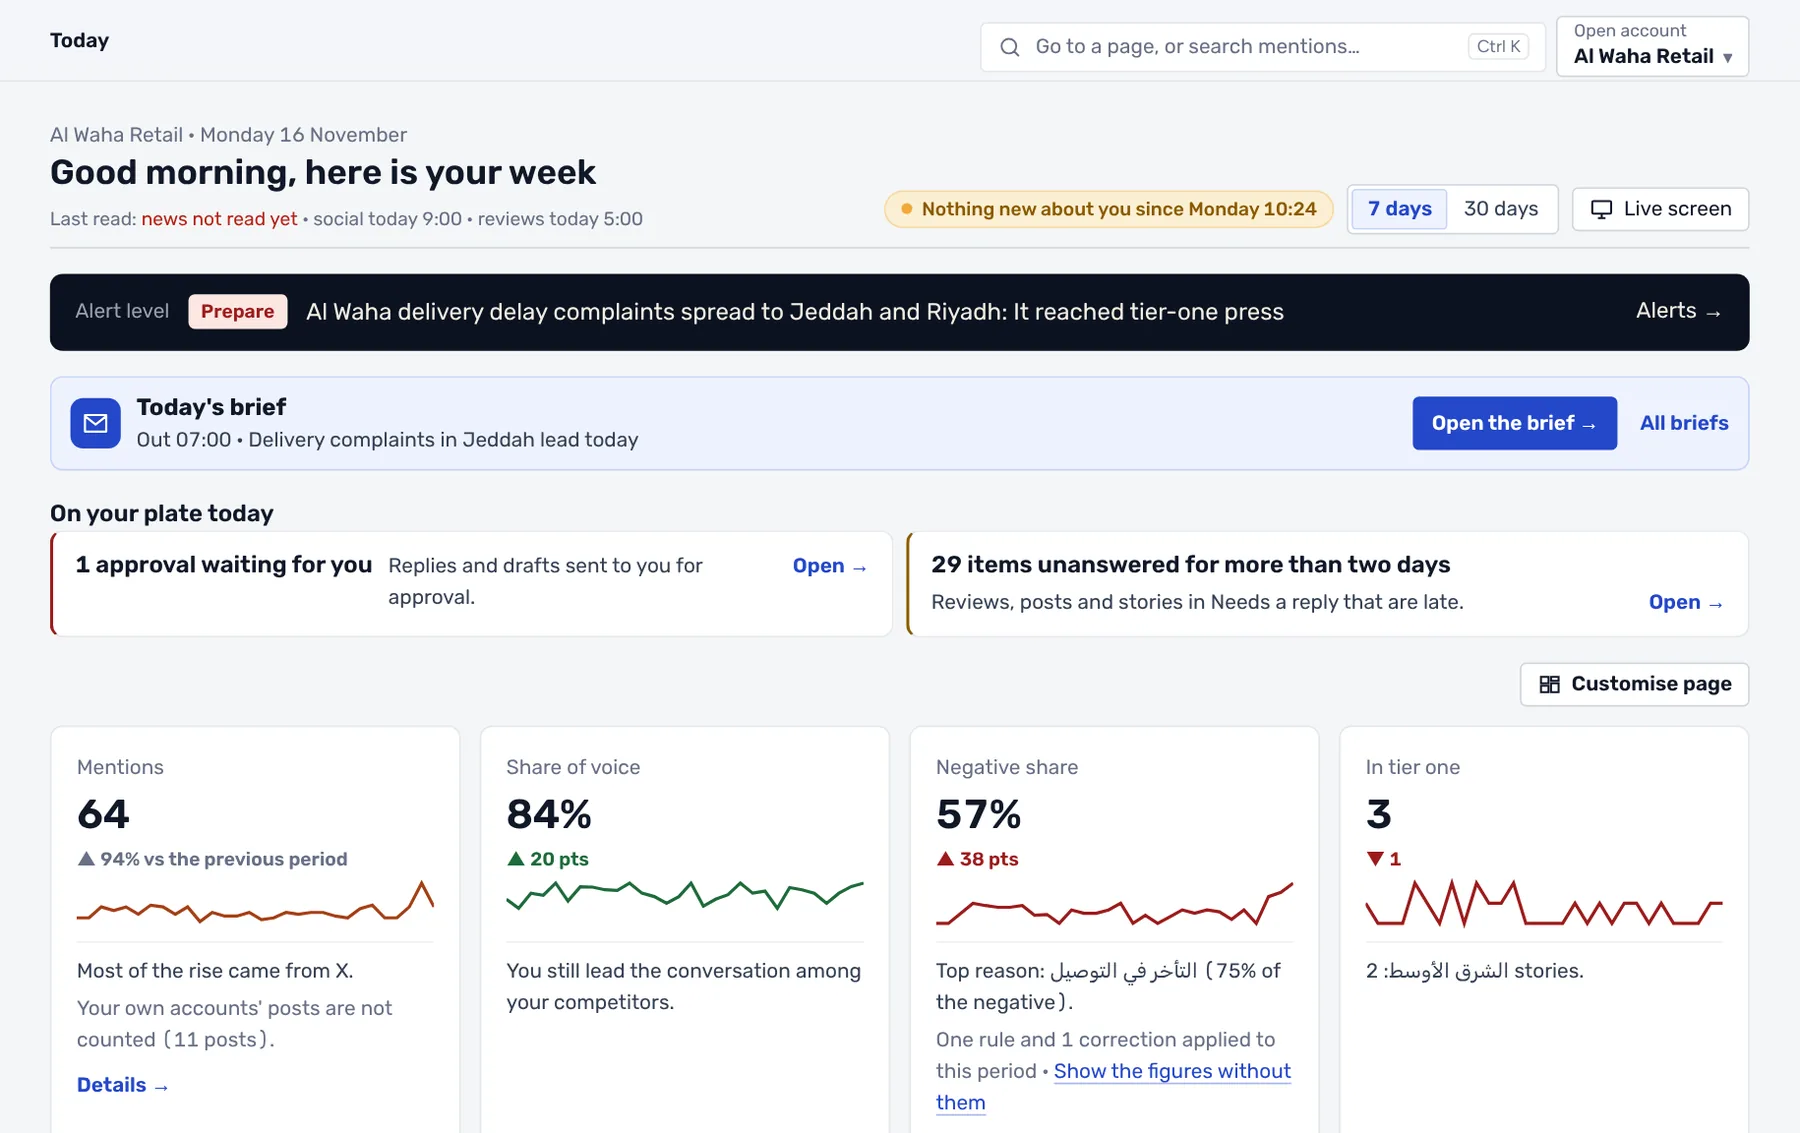
From the Ijaz app itself, with a demo company's data.
What you get
A line under every chart
"Mentions tripled yesterday because of delivery complaints in Jeddah." The number with its reason.
One definition per figure
Mentions, share of voice and tone are counted the same way on every dashboard, report and export.
One for leadership, one for the campaign
Save a dashboard for each audience and share it with your team.
By email every week
Choose who gets a dashboard each week, to read in their inbox.
How it works
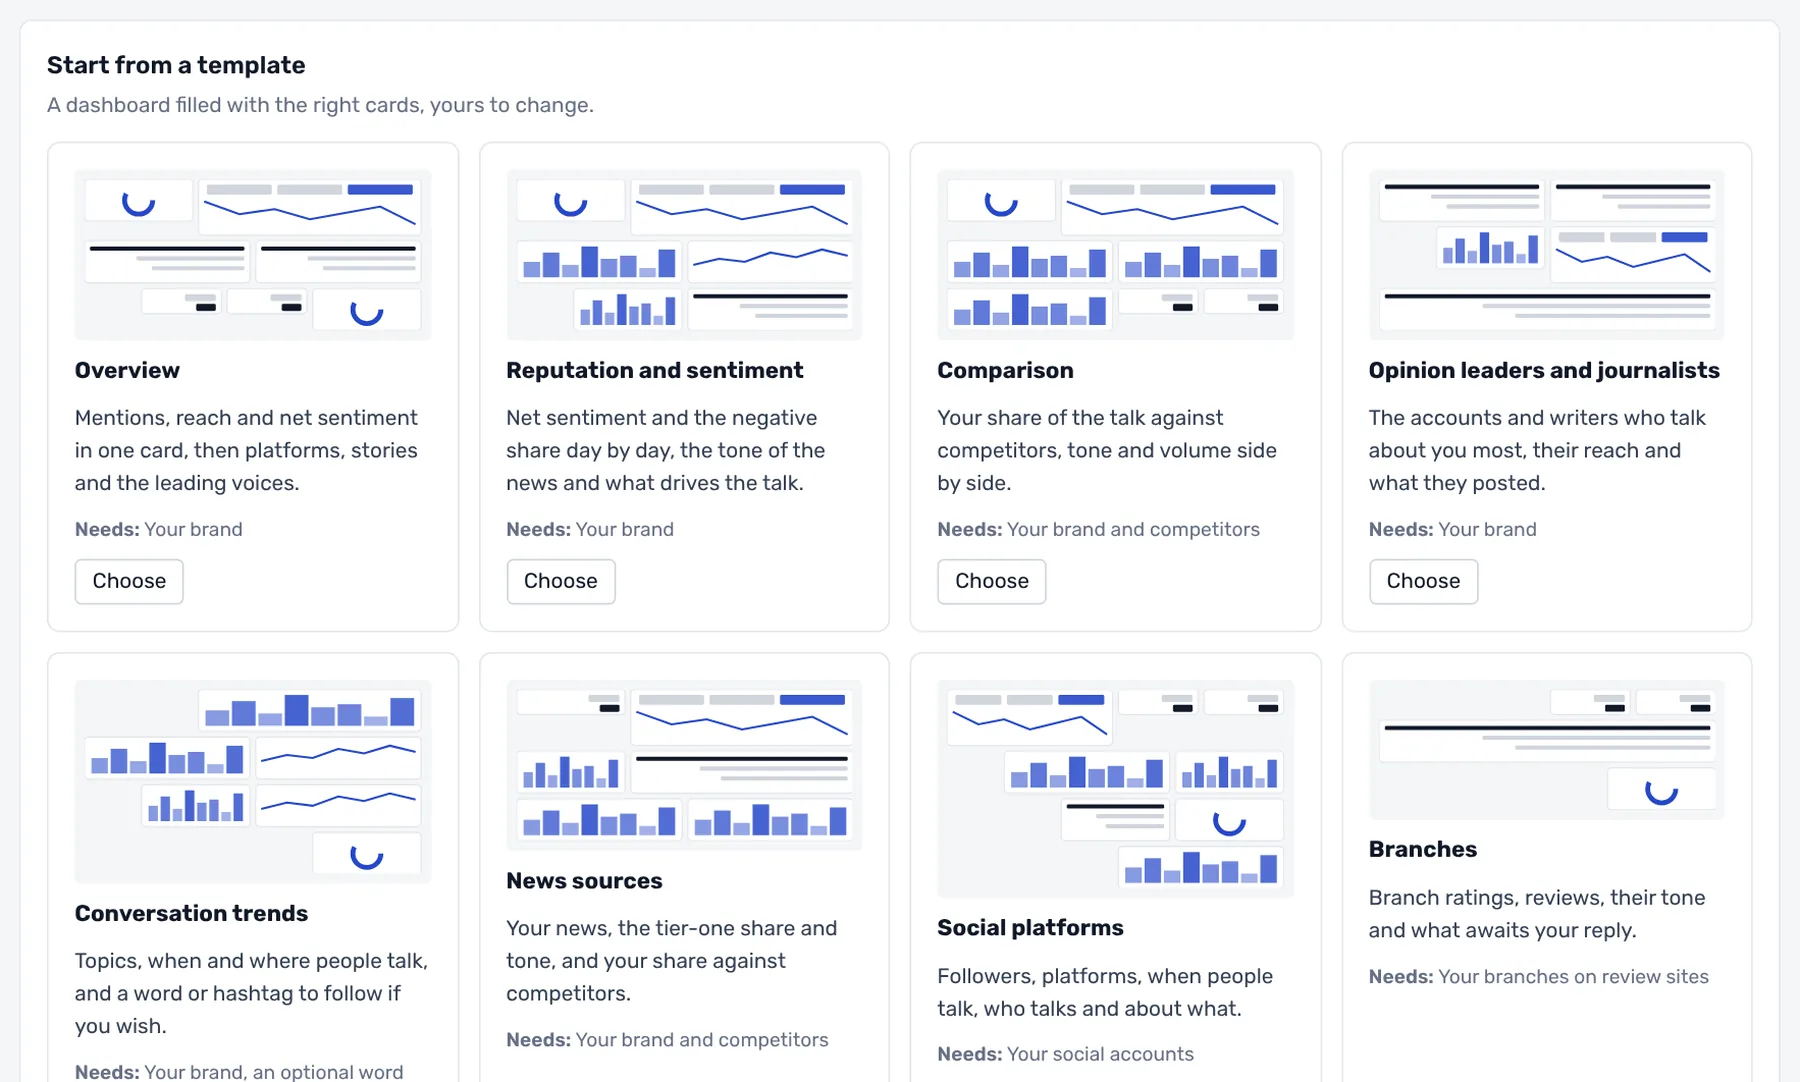
Four templates to start from
Competitor comparison, brand health, campaign and crisis. Save a dashboard, share it, and have it sent weekly to whoever you choose.
- 1You pick the widgets
Mentions, tone, share of voice, top posts, followers and reviews.
- 2You set the scope
Sources, competitors, period and the comparison with the one before.
- 3You save and share
By name, with your team, and by email weekly if you like.
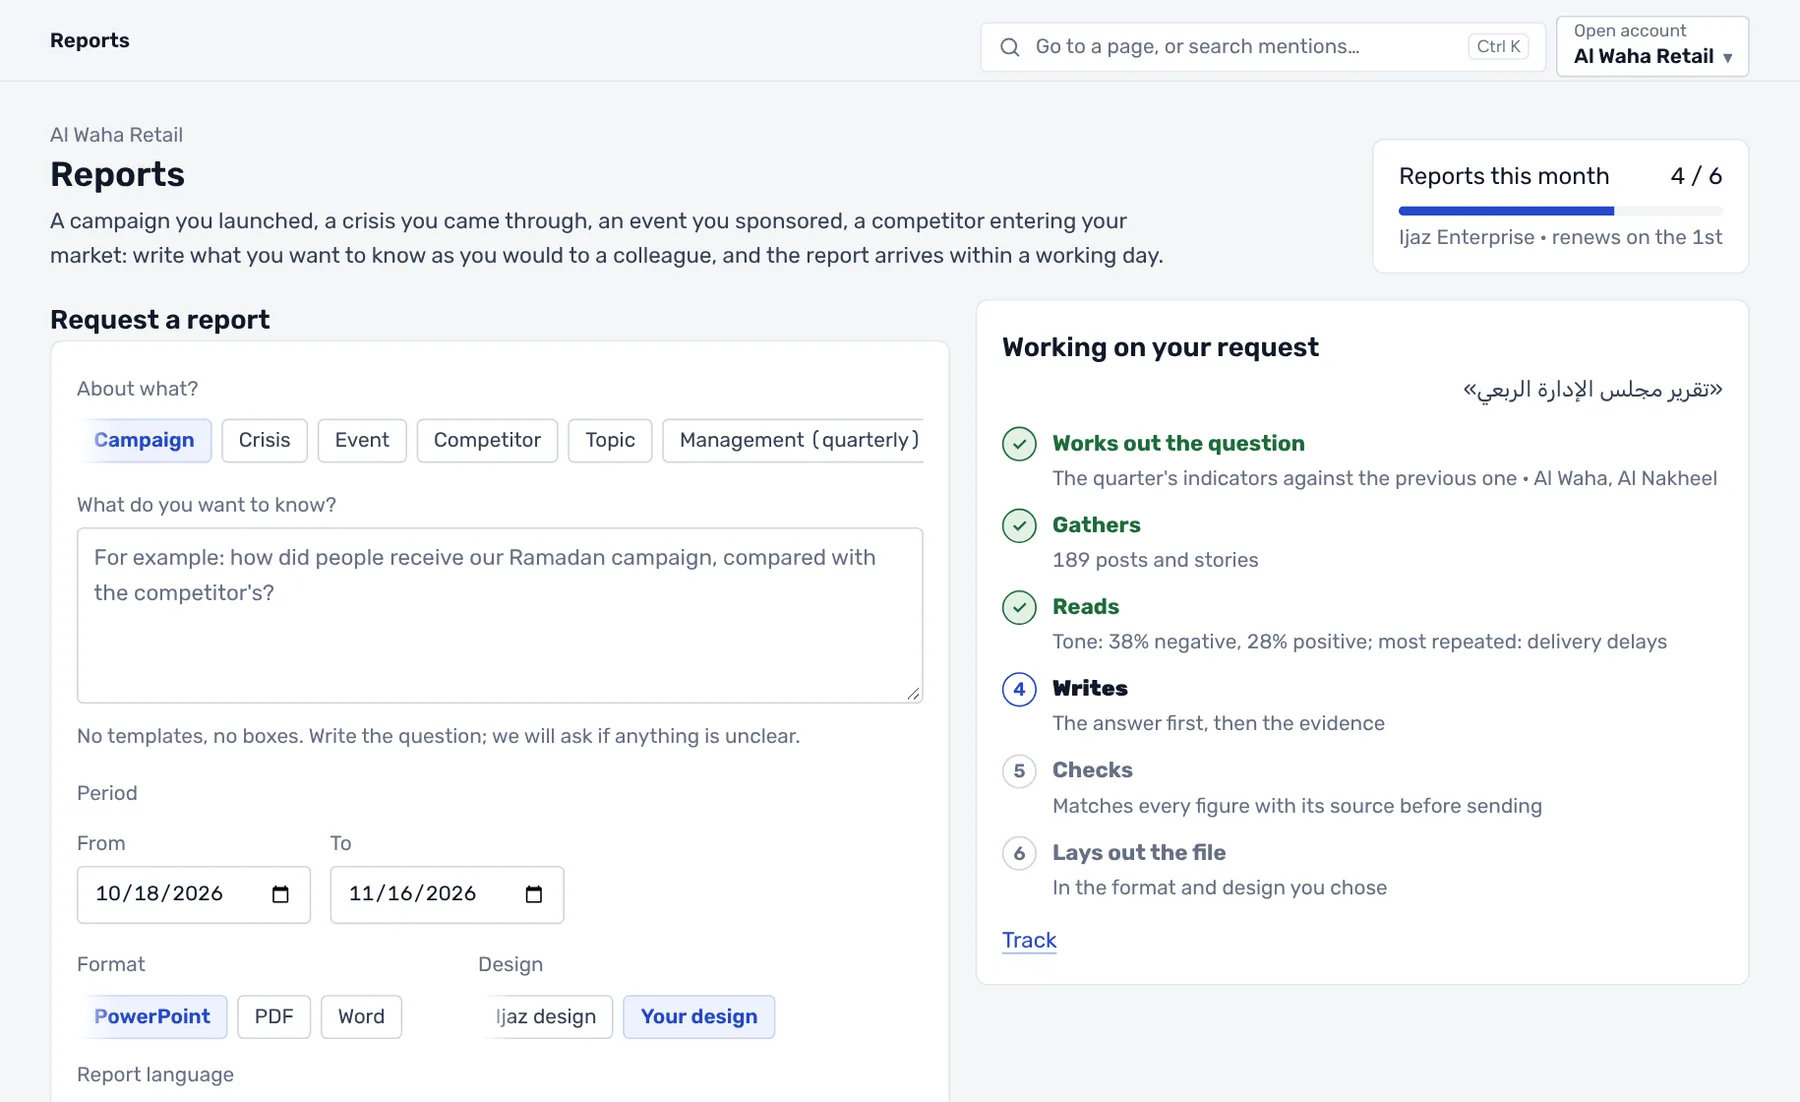 Reports
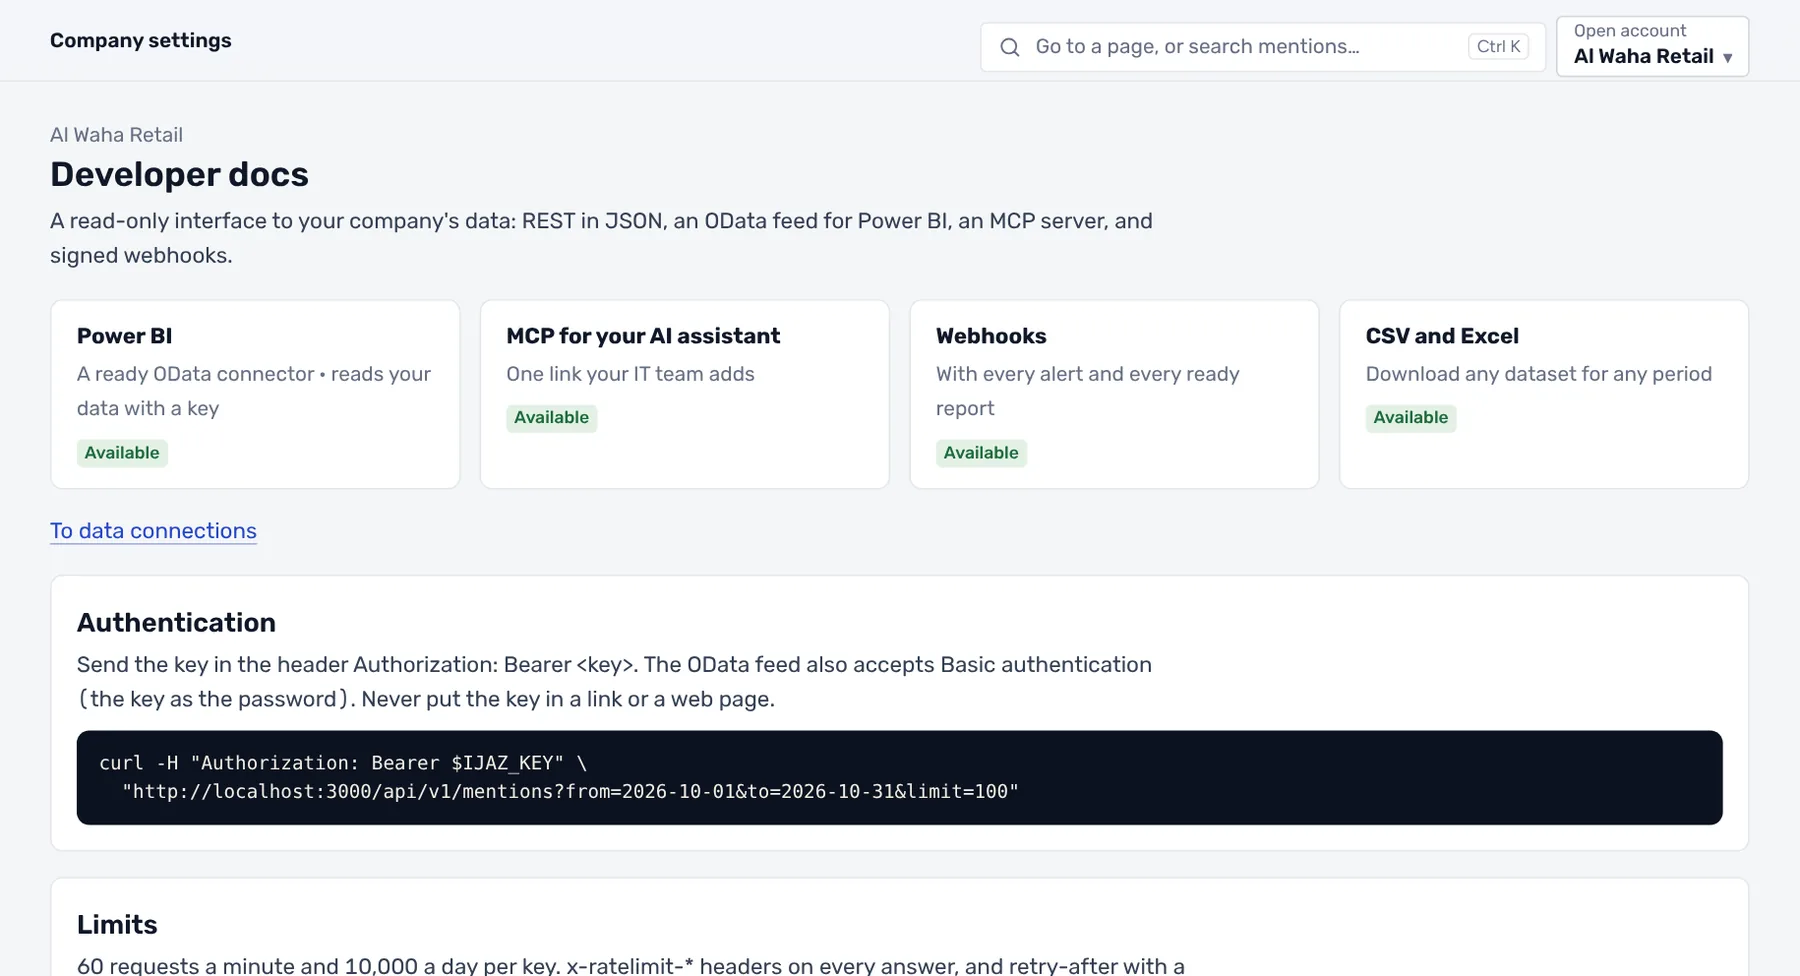 Connections and API
 Social media